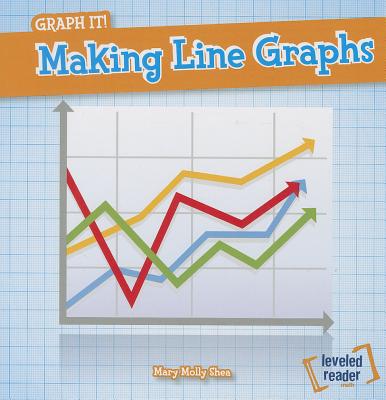
Line graphs are the perfect way to show how something changes over time. They can display how fast someone is growing, how many books they read each week, or how much money they make or lose over time. This book shows that line graphs are easy to read and fun to make! Questions within the text and an answer key help readers measure their understanding of this important math concept. Read More
Line graphs are the perfect way to show how something changes over time. They can display how fast someone is growing, how many books they read each week, or how much money they make or lose over time. This book shows that line graphs are easy to read and fun to make! Questions within the text and an answer key help readers measure their understanding of this important math concept. Read Less
Add this copy of Making Line Graphs (Graph It! , 3) to cart. $78.01, fair condition, Sold by Blue Vase Books rated 5.0 out of 5 stars, ships from Interlochen, MI, UNITED STATES, published 2014 by Gareth Stevens Pub Learning library.
Choose your shipping method in Checkout. Costs may vary based on destination.
Seller's Description:
Fair. The item is very worn but is perfectly usable. Signs of wear can include aesthetic issues such as scratches dents worn and creased covers folded page corners and minor liquid stains. All pages and the cover are intact but the dust cover may be missing. Pages may include moderate to heavy amount of notes and highlighting but the text is not obscured or unreadable. Page edges may have foxing age related spots and browning. May NOT include discs access code or other supplemental materials.